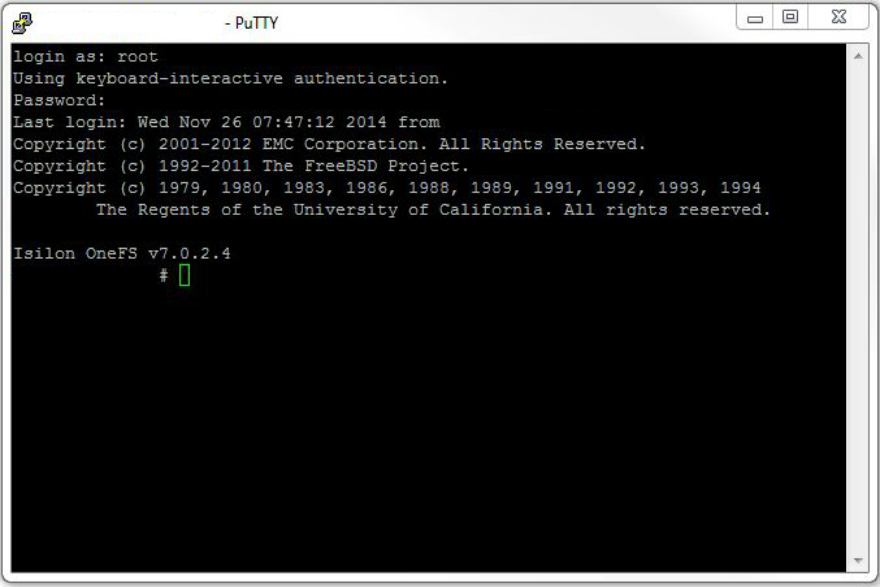
The following are some useful Isilon OneFS commands to administer and manage the Storage Cluster.
Note: OneFS commands sometimes get changed with the OneFS revision, the following command are tested on OneFS 7.0.2.4
- isi stat
command: isi stat
example output:
Isilon OneFS v7.0.2.4
nas001-1# isi stat
Cluster Name: nas001
Cluster Health:
Size: 50T (54T Raw) 1.1T (1.1T Raw)
VHS Size: 3.8T
Used: 17T (33%) 55G (5%)
Avail: 34T (67%) 1.0T (95%)
Health Throughput (bps) HDD Storage SSD Storage
ID |IP Address |DASR | In Out Total | Used / Size | Used / Size
——————-+——-+——+——+——+———+———-+——-+————-
1 |10.10.10.10 | OK | 0 | 256 | 256 | 5.5T / 17T( 33%) | 18G / 367G( 5%)
2 |10.10.10.11 | OK | 444 | 348 | 792 | 5.5T / 17T( 33%) | 18G / 367G( 5%)
3 |10.10.10.12 | OK | 0 |655K| 655K| 5.5T / 17T( 33% )| 18G / 367G( 5%)
——————-+——-+——+——+——+———+———-+——–+————-
Cluster Totals: | 444 | 656K| 656K| 17T/ 50T( 33%) | 55G/ 1.1T( 5%)
Health Fields: D = Down, A = Attention, S = Smartfailed, R = Read-Only
Critical Events:
Cluster Job Status:
No running jobs.
No paused or waiting jobs.
No failed jobs.
Recent job results:
Time Job Event
————— ————————– ——————————
11/08 01:00:00 SnapshotDelete[1256] Succeeded (MEDIUM)
11/09 01:00:00 SnapshotDelete[1254] Succeeded (MEDIUM)
- isi statistics
command: isi statistics client –orderby=TimeAvg -t
example output:
isi statistics: Sat Nov 08 10:00:00 2014
————————————————————
Ops In Out TimeAvg Node Proto Class UserName LocalName RemoteName
N/s B/s B/s us
1.0 376.8 244.0 42836.4 3 smb2 create DOMAIN\user2 10.134.153.12 10.22.19.23
5.6 1.6K 89K 23390.5 1 papi read UNKNOWN domain1.domain.com 10.145.97.3
0.6 174.4 125.8 5506.7 3 smb2 session_state UNKNOWN 10.134.153.12 10.22.19.23
55.0 6.9K 0.0 5456.0 1 http write UNKNOWN domain1.domain.com 10.145.97.3
8.8 1.0K 0.0 3505.4 3 smb2 read DOMAIN\user1 10.134.153.12 desktop1.domain.com
2.0 210.2 8.4K 375.6 3 smb2 namespace_read DOMAIN\user1 10.134.153.12 desktop1.domain.com
Command: isi statistics system –nodes
example output:
nas001-1# date ; isi statistics system –nodes
Sat Nov 08 10:00:00 2014
Node CPU SMB FTP HTTP ISCSI NFS HDFS Total NetIn NetOut DiskIn DiskOut
LNN %Used B/s B/s B/s B/s B/s B/s B/s B/s B/s B/s B/s
All 0.8 721.6 0.0 31.3 0.0 0.0 0.0 853.0 653.8 704.8 1.1M 0.0
1 0.7 151.0 0.0 131.3 0.0 0.0 0.0 282.3 169.0 238.0 1.0M 0.0
2 0.9 482.9 0.0 0.0 0.0 0.0 0.0 482.9 378.4 340.0 49K 0.0
3 0.7 87.8 0.0 0.0 0.0 0.0 0.0 87.8 106.4 126.8 40K 0.0
Command: isi statistics heat -t
example output:
nas001-1# isi statistics heat -t
isi statistics: Sat Nov 08 10:00:00 2014
————————————————————————————–
Ops Node Event Class Path
N/s
5.7K 2 lock other UNKNOWN
3.4K 2 lock other UNKNOWN
2.9K 1 lock other /ifs/smb/workfolder/maps/Test.txt
932.0 3 lookup namespace_read /ifs/
745.0 1 lock other /ifs/smb/workfolder/resources/MidOffice.doc
691.8 1 lock other /ifs/smb/workfolder/resources/Data.msg
648.2 2 read read /ifs/smb/personal/user1/testdoc1.doc
553.1 3 write write /ifs/.ifsvar/modules/tsm/sched/reports/reports.db-journal
551.7 3 lock other /ifs/.ifsvar/modules/tsm/sched/reports/reports.db-journal
486.6 3 contended other /ifs/.ifsvar/modules/tsm/config
Command: isi statistics query –nodes=all –stats=node.clientstats.active.cifs,node.clientstats.connected.cifs –top
example output:
isi statistics: Sat Nov 08 10:00:00 2014
———————————————————————————————-
NodeID node.clientstats.active.cifs node.clientstats.connected.cifs
1 124 1818
2 71 1254
3 89 1321
average 95 1464
Command: isi statistics query –nodes=all –stats=node.clientstats.active.smb1,node.clientstats.connected.smb,node.clientstats.active.nfs
example output:
isi statistics: Sat Nov 08 10:00:00 2014
———————————————————————————————-
NodeID node.clientstats.active.smb1 node.clientstats.connected.smb node.clientstats.connected.nfs
1 124 1818 61
2 71 1254 32
3 89 1321 26
average 95 1464 40
- Services
Command: isi services -a
example output:
Available Services:
apache2 Apache2 Web Server Enabled
auth Authentication Service Enabled
celog_coalescer CELOG Alert and notification system: event coalescer Enabled
celog_monitor CELOG Alert and notification system: system monitor Enabled
celog_notification CELOG Alert and notification system: notification daemon Enabled
cron System cron Daemon Enabled
isi_avscan_d AntiVirus Scan Daemon Enabled
isi_smartconnect SmartConnect Service Enabled
isi_smartquotas SmartQuotas Service Enabled
isi_snapshot_d Snapshot Daemon Enabled
isi_stats_d Statistics & Monitoring Enabled
isi_stats_hist_d Statistics History Enabled
nfs NFS Server Enabled
smb SMB Service Enabled
- Isilon maintenance jobs
Command: isi job status -v
example output:
Running jobs:
Job Impact Pri Policy Phase Run Time
————————– ——— —– ———- ——- ————
SmartPools[19541] Medium 6 MEDIUM 1/1 13:26:32
Progress: Processed 185136697 LINs and 254 TB: 163712027 files, 21424589
directories; 0 errors
Paused and waiting jobs:
Job Impact Pri Policy Phase Run Time
————————– ——— —– ———- ——- ————
FSAnalyze[19604] Low 6 OFF_HOU… 1/2 0:00:00 Waiting
Progress: n/a
MediaScan[9210] Low 8 LOW 5/7 1d 1:15 Waiting
Progress: Started
No failed jobs.
Recent job results:
Time Job Event
————— ————————– ——————————
11/10 10:00:00 SnapshotDelete[10566] Succeeded (MEDIUM)
11/11 10:00:00 SnapshotDelete[10580] Succeeded (MEDIUM)
- Uptime time for a cluster
Command: isi_for_array -s “uptime”
example output:
nas001-1: 10:45PM up 60 days, 13:31, 2 users, load averages: 0.18, 0.14, 0.10
nas001-2: 10:45PM up 60 days, 13:31, 0 users, load averages: 0.12, 0.07, 0.07
nas001-3: 10:45PM up 60 days, 13:31, 0 users, load averages: 0.05, 0.04, 0.04
- Create Shares
isi smb share create –sharename=testshare1 –path=/ifs/smb/testdir
isi smb permission modify –sharename= testshare1 -tbuiltin -aeveryone -dallow -pfullCommand OneFS 7.0.2.1:
isi smb shares create –name=”test share2” –path=/ifs/smb/testdir2 –description=”Testing shares in OneFS 7_0_2_1”
isi smb shares permission modify –share=”Testing shares in OneFS 7_0_2_1″ –wellknown=everyone –permission-type=allow -p full


Why are all the times the same?
I changed all the output time, so yes it does look the same but the output of Isilon data is not modified.